ANALYZE HELP
Index
Analyze is an image processing program, written by The Biomedical Imaging Resource at the Mayo Foundation. At the CBU, we use Analyze AVW, the current version of the Analyze program. Analyze software is useful for viewing and manipulating MRI and PET scans. It allows you to view scans from any angle, define regions of interest (e.g. mark regions of the brain which have incurred damage), and view 3D projection views of the brain. Despite the program's power, it is fairly easy to use. This introductory guide explains how to get Analyze up and running at the CBU. For a more in-depth introduction to the capabilities of Analyze, visit the Analyze home pagehttp://www.mayo.edu/bir/Software/Analyze/Analyze.html, or have a look at the analyze help system, which is in HTML format. You can reach this on the CBU system via the "Help" button on the Analyze main menu bar.Analyze reads images in a variety of formats, but also has a couple of formats of its own. For details on the Analyze image formats, have a look at the analyze data format page.
Windows or Linux users can also view Analyze format scans with MriCro. MriCro does not have all of the capabilities of Analyze, but it is easier to use and is free (the CBU has only one license for Analyze, so only one individual can use it at a time).
Analyze runs on a Sun workstation. If you have a Macintosh or Windows PC, you can run Analyze using a Unix X-Windows terminal emulator (e.g. eXceed, see the CBU technical support staff). If you use a Macintosh or PC, make sure that your display is configured for thousands or millions of colours: running Analyze with 256 or fewer colours will cause the program to run slowly and the images to look grainy.
Windows users can check their display setup by right-clicking on the desktop and selecting the 'Properties' command. The 'Display properties' window will appear. Click on the 'settings' tab to view and change the 'colors'. Macintosh users can check their display settings by selecting the 'Monitors' control panel.
Once you have started your Sun session, you can run Analyze by typing 'analyze' from the Unix prompt (alternatively, click the left mouse button on the desktop, and drag the cursor to the 'Applications/Analyze' command). This will load an Analyze workspace, similar to that shown in the figure below. Note that the CBU has only one licence for Analyze, so only one individual can use the software at any time. If someone else is using Analyze, the program will refuse to load.
The first thing you will need to do is to load the images you wish to view or edit. To load an image, choose 'File/Load'. Enter the name of the image which you would like to view (e.g. /cbu/imagers1/chris_brains/intelico.img). Once you have loaded an image, an icon will appear in Analyze workspace (see the figure below). You can load several images to edit and view them simultaneously. If the file was stored in an unusual format (e.g. as sagittal slices instead of transverse slices), you can use the 'File/Load as' command to rotate the images (or, to permanently change the image's rotation, load the image and then select the 'File/Save as' command).
When you are done using Analyze, selecting 'File/exit' will unload all of your images and close your Analyze windows.
|
This picture shows the Analyze workspace. Currently, two images have been loaded into memory: 'sm02974_1094' (which is in sagittal format) and 'intelico' (which is stored in the standard transverse format). The red box around 'intelico' indicates that this is the currently selected image (any commands selected from the menus will affect the selected image). To select an image, simply click on its icon. |
Run Analyze (See the Getting Started section). Load a Brain into the 'work space', using 'File/Load' and select the brain you wish to view. Then select the command 'Display/Multiplanar sections' if you want to see the standard views (sagittal, coronal, and transverse), or choose 'Display/Oblique sections' to view slices at custom angles. A new window will appear which will display the image (see the figure below).
- Select 'Generate/Slice' to show a draw the image slice. A dialog will appear that lets you select which slice will be viewed. Drag the 'slice' slider forward and back to select the desired slice.
- Select 'View/Size' to adjust the image size (you will need to move the slice slider to see the updated size slice).
- Select 'View/Intensities' to adjust the brightness of the image (a window with a double-ended slider will appear, allowing you to adjust the contrast).
- Select the 'T'ransverse, 'C'oronal or 'S'agittal button to select the view you wish to display.
When you are done viewing an image, you can close the window by selecting the 'File/Exit' command.
|
This picture shows the multiplanar sections of the image 'n045103'. Note that the 'S'agittal button is depressed in the toolbar, which corresponds with slice displayed. |
Run Analyze (See the Getting Started section).
PART 1: TO SET YOURSELF UP
- Load a Brain into the 'work space', using 'File/Load' {choose the scan you wish to create an object for}
- Choose 'Process/Segment/Image edit'.
- Adjust size to desired size using 'View/Size'
- Adjust intensity to desired intensity using 'View/Intensities'
- Change orientation to desired orientation using 'Generate/Orientation'
- Scroll through to the first relavant slice using 'Generate/Slice'
PART II: TO DEFINE AN 'OBJECT' WHICH WILL BE USED TO MARK THE LESION
- Choose 'File/Create object map'
- click on attribute
- press 'Add object', to create a new object
- Change attribute to 'name' and type over the word 'object' with a new name, say 'blob'
- Change attribute to 'color', then press on the tiny color palette to the right of the new name you have assigned ('blob'). A colour edit box will appear and you can adjust the thresholds to create the colour of your choice for 'blob'.
|
This figure shows the image editor described in the text. A red region of interest has been drawn on the left temporal lobe. |
PART III: TO EDIT THE DEFINED OBJECT SUCH THAT IT DEFINES THE LESION
- Under 'Generate/Edit' options change 'edit intensity' to object map
- Change 'defined object' from 'Original' to whatever you have named your new object i.e. 'blob'.
- Reopen 'View/Intensities' and change Type to 'Object Color'
- On your brain, choose the 'closed trace' function (it has a little pen icon and is located to the left of the icon called 'auto')
- Draw around the lesion using the mouse left hand button as a pen.
- Choose 'flood fill' (near the bottom, with a bucket and a clock) and click in the centre of your defined region. It will turn red.
Important: Choose 'Change Image' at the bottom of the icon box. This will change to the next slice, which also serves to 'activate' the defined region.
- The reset the trace function by pressing 'reset'
- Move back to the original slice by pressing the minus button on top of the icon box.
- Your region should have been defined.
- Then proceed to the next slice and go from step 5 above.
PART IV: SAVING THE OBJECT MAP
- Choose 'File/Save object map'
- Type in a new name.
PART V: RELOADING THE OBJECT MAP AT A LATER DATE
- Load the brain as above
- Choose 'File/Load object map' to load the object map.
One of the most powerful features of Analyze is its abilities to create 3D projection views of the brain or of specific regions. This allows you to see the shape of the desired region.
|
This image shows a series of 3D projection views created by Analyze. |
The first step in creating these projection views is creating a scalp edited MRI image for rendering.
To create a scalp edited version of an MRI image, follow the following steps. 1. Load the MRI image you want to scalp edit
Select Process->Segment->Object extractor from the main menu system
- You should now see a window a bit like this, containing an axial slice of the image you have just loaded:
|
The object extractor window. |
From this window, select the Generate->Define region menu item
- You now see a window like this:
|
The region definition window. |
- This window is for you to set upper and lower thresholds to define which bits of the image are brain, and which are not.
- Now click on the the Define Region button, to get this window:
|
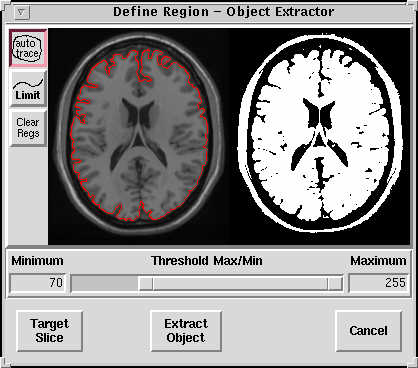
The second define region window. Note that the auto trace button, at the top left, is selected by default. |
- The program is showing you the default slice. If you don't think this slice gives you the best view of the brain edge etc, you can click on the Target Slice button, and, in the window that comes up, move to a different slice. When you are happy with the slice you are working on, press Define Region button to continue, returning to the window shown above.
- So, in the window shown above, click on the brain, on some bit of the hemispheric white matter. This changes the window to give you a left and a right pane, as in the picture below. The left is your brain image slice, and on the right is a binary version of the image, with white in areas which are going to be retained, and black in regions that are to be removed from subsequent processing steps. You should see a red dot on the left brain image at the place you clicked. This is the 'seed' for an 'auto-trace':
|
The thresholding window of the define region process. Note the red dot in the white matter just left of the caudate nucleus in the upper middle of the left hemisphere. |
- You now should move the left and right end of the thresholding slider at the bottom of the screen, by dragging with the mouse, or typing numbers into the boxes at eigher end, so that the binary image on the right is white up to the edge of brain that you want. Usually you can pull the upper end to its maximum, and then adjust the lower end to taste. Below is the same window, after I have adjusted the slider to define the brain edge I want:
|
The thresholding window of the define region process, after thresholds have been adjusted. The red line on the left image defines the edge of the brain, and the binary image on the right shows the areas retained after the thresholding. The scalp will be removed in the next processing steps. |
- Click on the Extract Object button. You should be presented with the following dialog box:
|
The options dialog box for object extraction. At the top you see the max and min you have selected for your threshold, and the position, in voxels, (X,Y, and Z) of the seed point you selected (the red dot in the image above). You may wish to change the name of the new scalp edited image in the Output File Name string input; the other options are usaully OK. |
- Click OK if you are happy with the options. Analyze then begins a series of operations that should result in a new scalp edited image. It will display this to you in the Object Extractor window. If things have gone well, it might look a bit like this:
|
The main Object Extractor window, after the object extraction process has finished. The window shows nice rendered views of the scalp edited image. |
If this looks OK to you, then you might want to save the scalp edited volume using the File->Save extracted volume item on the menu in the Object Extractor window. Hey presto, you've done.
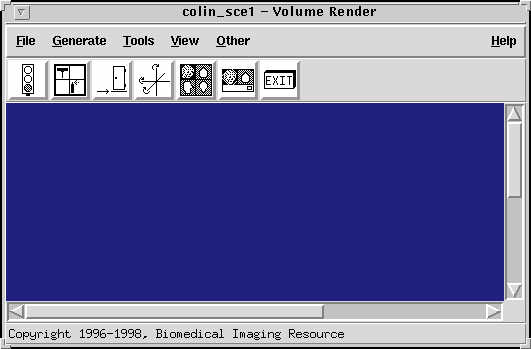
Analyze is excellent at displaying rendered views. This works particularly well for scalp edited images such as those created using the process above. To experiment with this part of analyze, go to the main analyze window, select the image you want to render, either by clicking on it or loading it, and then try the Display->Volume render menu item. The following window comes up:
|
The volume rendering window. |
Click on the traffic light icon to see a default rendered view. To change this view, choose the Generate->Rotation menu item. You will get a dialog box that looks like this:
|
The default rotation dialog box. |
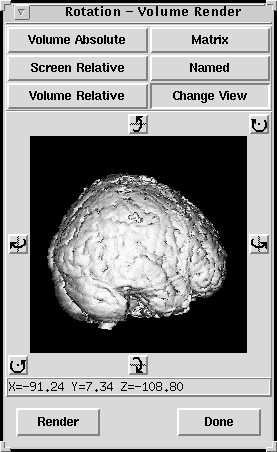
From here, click on the Change View button to get an interactive view of the brain, which you can drag to create new views:
|
The Change View version of the rotation dialog box. Click on the image and drag to rotate, or use the rotation icons around the image. |
Click on the render button in this window to see the result of the rotations in the main Rendering window.There are many other options to play with in this module, including the ability to superimpose other images on the rendering, such as activation maps, (File->Related volume->Load in the Rendering window menu). However, it is not easy to create a standard shades of red type rendered display from an activation map.
If you run into difficulties, you can contact one of the other members at the CBU who uses Analyze. Adrian Owen and Matthew Brett have a bit of experience with Analyze. Another option is to contact members of the Wolfson Brain Imaging Centre, as they use Analyze regularly.
Page written by Chris Rorden, MatthewBrett and Adrian Owen.


