Diagnostics for FMRI
There are several ways of detecting problems with FMRI datasets. Here I describe two; using summary images, and using time series diagnostic plots.
Using summary images
There are a variety of summary images that are useful. The mean of all the images in the time series is the most obvious; it will show you any obvious problems with the shape of the image, large amounts of ghosting, and some reconstruction problems. The mean image can be automatically created using ana4dto3d, by realignment in SPM, or by using the spm_imcalc_ui routine in SPM. To use the spm_imcalc_ui button:
go to the matlab console window (with the >> prompt)
type "spm_imcalc_ui(, 'myseries_mean.img', 'mean(X)', {1;0;4;0})"
- Select the images to work on (for example all the 3D images for this run)
- Now you have a new image "myseries_mean.img" in the SPM current directory, which you can review with the SPM Display button.
Here's an example of a normal EPI mean from a WBIC FMRI single run:

Another useful diagnostic image is the variance image. This is again automatically created by ana4dto3d, but can also be created with spm_imcalc_ui by using 'var(X)' instead of 'mean(X)' in the procedure above. Here is an example of a mean image from a WBIC dataset:

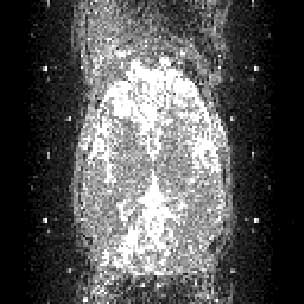
Variance images are useful for detecting some more uncommon image artefacts, including slice droupout, radiofrequency artefact and high ghost variance. You can open them using MriCro, and you will need to adjust the contrast to give you an image which shows you the levels of variance within the brain. Here are some examples: slice dropout (loss of signal for a single slice of one or more volumes) causing high variance in a single slice:

High ghost variance, with radiofrequency artefact (bright dots on axial slices, vertical lines on sagittal / coronal slices - i.e. in the slice axis): axial

and sagittal:

Time series diagnostics
There are also some routines for diagnosis of problems in the time series. These are installed in the CBU; from outside, you can download the archive tsdiffana.tar.gz; you will need to unpack the files therein into a directory on your matlab path.
The routines give diagnostic plots of the files from an individual run. Run the utility with
>> tsdiffana
at the matlab prompt. Select the files for one run, and press Done. Say No when asked if you want to write difference images. The routine writes out mean, standard variance, and slice to slice variance images in the directory containing the files. You will soonish get a plot in the SPM graphics window like this:
The top panel shows the variance from image to image; i.e the mean of the squared differences between the corresponding pixels for a pair of images in the series. Thus the first difference image point shows the mean squared difference between the first and second image selected, difference image point 2 corresponds to the second and third image selected, etc. The variances have been divided by the mean signal intensity across all voxels and all images, to take into account differences in absolute signal intensty.
The second panel shows the variance broken down by slices. Here the values for are the mean sum of sqared difference for (say) slice 1 between the pairs of images. Again the varaince has been divided by the overall average voxel intensity. Each slice is displayed with a different colour. Note that one slice (shown in blue) predominates; this is the slice containing the eyes, which have high variance due to eye movements.
The third panel shows the mean of the voxels in each image, again divided by the mean of all voxels in all images, to show any sudden shifts.
The last panel shows the variance by slices (as for the second panel), but this time with the slice number along the x axis instead of time. The red shows the maximum value for the variance for each slice. So, if t(2, 4) is the mean of the squared differences between the voxels of slice 4 of image 2 and slice 4 of image 5, then the maximum for slice 4 will be the maximum of t(1,4), t(2,4), t(3, 4) .... This will pick up any slices with high maximum variance, such as occurs with slice dropout. The black line is the mean variance, and the blue line is the minumum. The pattern shown here is fairly typical, with the lower slices, which include the eyes, brainstem etc having relatively higher variance.
This allows you to pcik up large spikes of variance, which are often associated with movement, or sever artefacts. For example, here is the plot for a run where the gradient coil stopped working for a few volumes in the middle of the run:


