|
Size: 227
Comment:
|
← Revision 26 as of 2013-03-08 10:02:29 ⇥
Size: 1265
Comment: converted to 1.6 markup
|
| Deletions are marked like this. | Additions are marked like this. |
| Line 2: | Line 2: |
| Soon there will appear more useful information on this page. Until then, explore the commercial software packages that are available at the CBU: http://imaging.mrc-cbu.cam.ac.uk/meg/CommercialPackages | One advantage of the "grand-mean" approach is that you can explore a range of source estimation techniques, e.g. implemented in commercial or freeware software packages, and take advantage of their visualisation functionalities. Below this is briefly illustrated using some plots from the commercial software package CURRY (V6). Look here for more commercial software packages that are available at the CBU: http://imaging.mrc-cbu.cam.ac.uk/meg/CommercialPackages For starters, you can explore your data in signal space, with respect to time course information and topographies: {{attachment:curvesmaps.jpg}} You can use a standard head model as a volume conductor for your source estimation, for example the the boundary element model (BEM) created for the Montreal average brain: {{attachment:bemmodel.jpg}} You can choose from a range of source estimation techniques (dipole models/scans, various minimum norm methods, beamformer), and compare the results. The following image shows the result of a standard minimum norm solution on the brain surface: {{attachment:CSDview.jpg}} You can overlay the solution on the MNI standard brain, and obtain Talairach coordinates and Brodmann areas: {{attachment:mriview.jpg}} |
Source estimation
One advantage of the "grand-mean" approach is that you can explore a range of source estimation techniques, e.g. implemented in commercial or freeware software packages, and take advantage of their visualisation functionalities. Below this is briefly illustrated using some plots from the commercial software package CURRY (V6). Look here for more commercial software packages that are available at the CBU: http://imaging.mrc-cbu.cam.ac.uk/meg/CommercialPackages
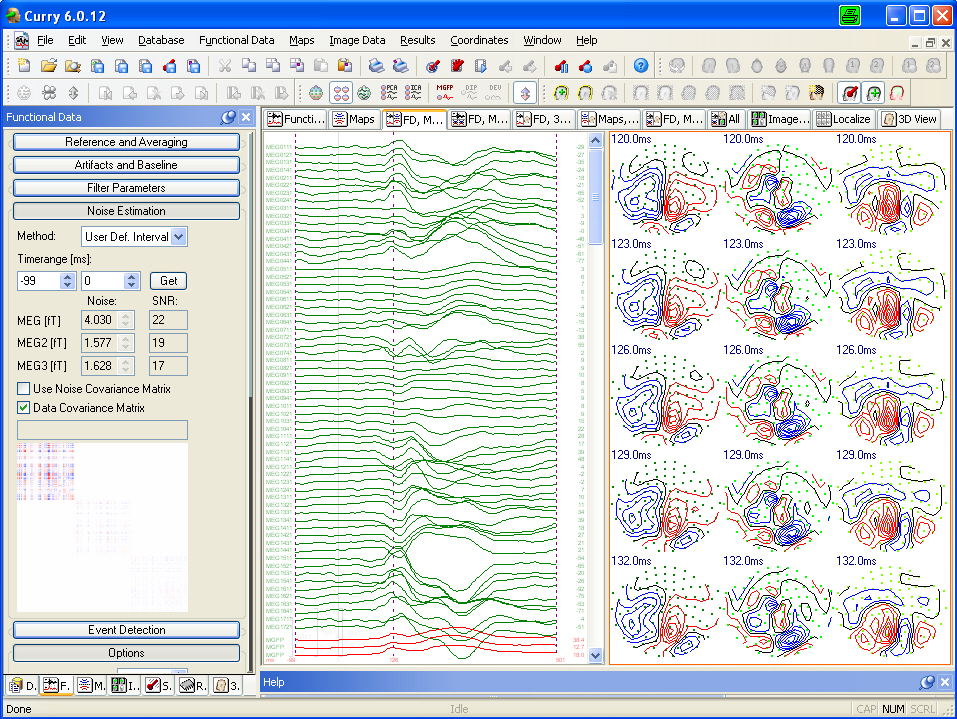
For starters, you can explore your data in signal space, with respect to time course information and topographies: 
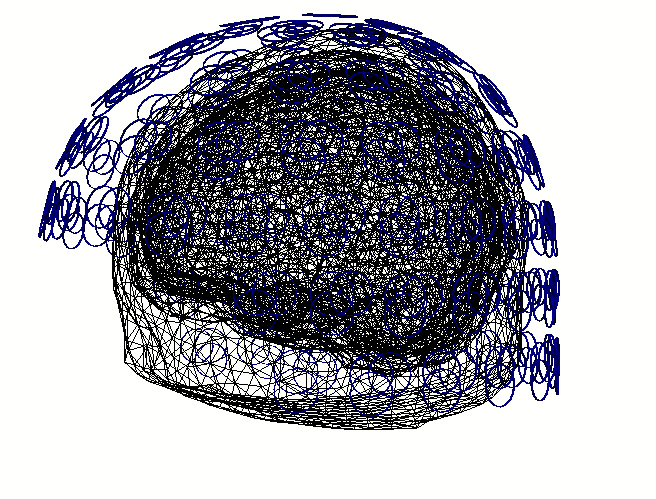
You can use a standard head model as a volume conductor for your source estimation, for example the the boundary element model (BEM) created for the Montreal average brain: 
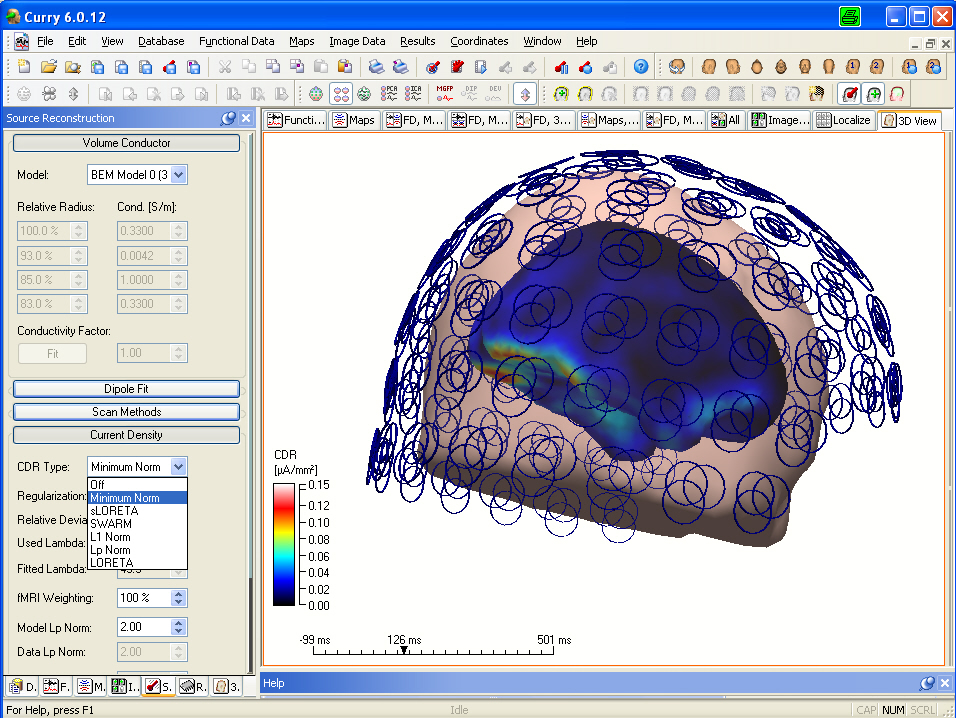
You can choose from a range of source estimation techniques (dipole models/scans, various minimum norm methods, beamformer), and compare the results. The following image shows the result of a standard minimum norm solution on the brain surface: 
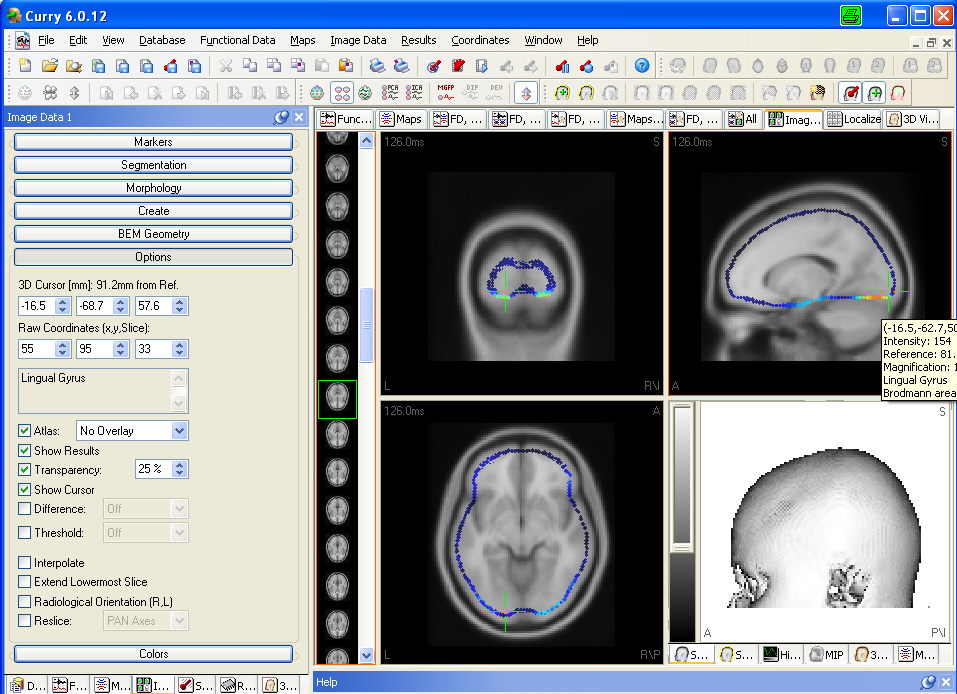
You can overlay the solution on the MNI standard brain, and obtain Talairach coordinates and Brodmann areas: 
